This study investigates the spatio-temporal trends and endemicity of JE and AES in the Gaya and
Nawada districts of Bihar between 2016 and 2020. JE/AES have become a great menace to
public health in India, especially in the tropical and subtropical environs. This study uses spatial
statistical techniques such as Global and Local Moran’s I, cluster and outlier analysis, and Getis
Ord Gi* hot spot analysis to identify high-risk blocks and the emerging spatial patterns. The
epidemiological data were collected from the State Malaria Office and analysed through GIS
based methodology. The results highlight clustering of JE/AES cases in the Gaya district, with
Manpur, Imamganj, and Atri emerging as the persistent high-risk blocks. Despite a general drop
in reported incidences over the years, the spatial clusters and hot spots continue to exist, thus
depicting localized endemicity. The Nawada district consistently records lesser incidences and
emerges mostly as a cold spot zone. The study, therefore, highlights the importance of spatial
epidemiology to ensure focused surveillance and control of diseases. In identifying the persistent
high-risk areas, it imparts support for rationalizing resources and public health interventions.
The study further exemplifies how spatial statistical tools can be of great use in decision-making
for the mitigation of vector-borne diseases at a local level.
Keywords: Acute Encephalitis Syndrome; Disease mapping; Gaya and Nawada; Spatial Analysis;
Vector borne diseases.
How to cite this article: Jha, S., Anuranjan, Ashwani, Kumar, A. (2026). Spatio-Temporal
Risk Mapping of Japanese Encephalitis/Acute Encephalitis Syndrome in the Gaya and Nawada
Districts of Bihar. Indian Journal of Health Social Work, 8(1), 84-94.
Vector-borne diseases are illnesses
transferred to humans by communicators such
as mosquitoes, sandflies, and evil vectors.
These are imposed by parasites, viruses, and bacteria, and these diseases form major
groups of infectious diseases worldwide, with
serious threats to public health. According to
the Global Vector Control Response of WHO
in 2017, vector-borne diseases covered 17
percent of the total global burden of
communicable diseases with more than
700,000 deaths yearly.1 The shocking truth is
that vector-borne diseases risk has been
i mposed on nearly 80% of the world
population, while almost half of the world’s
population is at risk from two or more vector
borne diseases.
In India, the National Vector Borne Disease
Control Programme has considered Malaria,
Dengue, Kala-azar (Leishmaniasis), Lymphatic
Filariasis, Chikungunya, and Japanese
Encephalitis as some of the most important
vector-borne diseases.2 Furthermore, there
have also been reports of localized outbreaks
of diseases such as Kyasanur Forest Disease
(KFD) and Crimean-Congo Hemorrhagic Fever
(CCHF) in some specific regions. These
diseases have a myriad effect on the general
health of people, with approximately millions
at risk and several thousand falling ill every
year. In the year 2016 alone, India recorded
approximately one million malaria cases, over
1 lakh cases of dengue, more than 60,000
cases of Chikungunya, 6,000 cases of Kala
azar, and over 1,500 cases of Japanese
Encephalitis.
The resurgence of these diseases in a matter
of decades, with their rapid fast spreading
over new regions, and increased transmission
taking place in endemic areas, makes vector
borne diseases a growing threat. This
increase in incidence is not only a challenge
to India’s public health infrastructure but also
a cause for concern at an international level.2
These developments call for stronger health
systems and coordinated administrative
responses to effectively manage and mitigate
their impact.
These vector-borne diseases seem to pose
the greatest risks in tropical and subtropical
regions. Other prevalent vector-borne
diseases worldwide include Malaria, Dengue,
Lymphatic Filariasis, and Schistosomiasis.
Other important vector-borne-type diseases
include Chikungunya, Onchocerciasis, Chagas
disease, Leishmaniasis, Zika virus, Yellow
Fever, and Japanese Encephalitis.1 A viral
illness, Japanese encephalitis is the primary
factor causing viral encephalitis in Asia.
According to the WHO’s 2017 Key Facts, it is
a flavivirus transmitted through the bites of
female mosquitoes from the Culex mosquito
group, specifically Culex tritaeniorhynchus,
Culex vishnui, and Culex pseudovishnui.
According to the NVBDCP of 2011, the JE virus
is largely zoonotic in nature, with humans
serving as unintentional hosts.3
As a result of the development of an efficient
vaccination, JE now only accounts for 15 per
cent of all cases of Acute Encephalitis
Syndrome (AES) in the nation. The
Government of India has adopted a multi
sectoral collaborative strategy to control AES
as the patterns of AES vary among states.
According to reports, there are roughly 1,000
cases of Japanese encephalitis per year in the
Southern, Northern, and North Eastern states,
with death tolls varying from 100 to 34,200.
In India, JE has been widely spread
throughout time. The first case of Japanese
encephalitis recorded was in 1955. There
have reportedly been outbreaks around the
nation. Between 1998 and 2004, JE cases
were reported in more than 15 states and UTs.
The states with the highest prevalence of the
disease are Assam, Uttar Pradesh, Bihar,
Odisha and Tamil Nadu. In addition to these
states, low JE incidence has also been
reported from other parts of India. Uttar
Pradesh and Assam account for more than 80
per cent of all JE cases in India.
The epidemiological situational analysis of
AES/JE prevalence in Bihar shows that the
cases were reported from 31 districts of Bihar. The intensity of cases differs year basis. The
High reporting cases are from Gaya, Patna,
Muzaffarpur almost 50 per cent of all the
cases of AES/JE in Bihar. The AES/JE cases
show a decline in recent years from 324 cases
in 216 to only 58 cases in 2020. But the re
emergence nature of this disease in any
particular year poses a serious threat to the
state.
JE and AES have emerged as major public
health concerns in Bihar with districts such
as Gaya and Nawada recording outbreaks
every now and then. Spatio-temporal analysis
of these diseases is very much essential for
identifying high-risk areas and adhering to
timely intervention measures. Climatic
variables have been suggested by many
workers to influence JE incidence patterns
across Bihar, thus hinting at a seasonal and
geographical pattern of outbreaks.4,5 Spatio
temporal studies in neighbouring areas such
as eastern UP and Nepal have identified
disease clusters and environmental
correlates.6,7 The studies also bring into focus
the role of the pig population as amplifying
hosts and the susceptibility of children in
endemic areas.8,9 The present study combines
GIS mapping and epidemiological data for a
more efficient regional surveillance
intervention strategy. Aside from climate and
environmental factors, the social and
demographic vulnerabilities have been taking
a bigger part in the occurrence of JE/AES. It
is recognized that the diseases are being
retained in certain areas mainly due to
poverty, illiteracy, no food, bad hygiene and
unawareness about health care facilities. The
problems are more complicated in Bihar, as a
great part of the rural population there is not
provided with healthcare and education of
good quality. This opens the door for vector
borne diseases to take their toll heavily. On
top of that, the agricultural workers who come
into contact with the vectors and also the
communities living next to the pig farms are
at higher risk. Thus, it becomes indispensable
to consider social determinants of health in
order to get the complete picture of the
endemicity and to control it through more
integrative disease intervention approaches.
The spatial-temporal analysis of the vector
borne disease clearly shows that even though
all the six major vector-borne diseases are
prevalent in India as well as in Bihar. The
detailed analysis of all the vector-borne
diseases at the state level could not be
feasible within the limited point of time
therefore, the selection of the disease is to
be made for our study to have a deeper
understanding of the pattern of these disease
occurrences. Thus, for this purpose two
major diseases have been selected for the
present research, Kala-azar and Japanese
Encephalitis.
Vector-borne diseases are generally endemic
to a region, putting populations residing in
those regions at risk of contracting the
disease. The major aim of risk mapping is to
measure the degree of risk of a specific
disease in a specific population at a specific
period. Disease mapping is a crucial
investigative tool in epidemiology, as it helps
monitor preventative efforts, identify high-risk
locations, and offer fresh insights into the
genesis of disease. Even while disease
mapping is a crucial tool for visualising
disease spatial pattern data, without any
statistical approach it becomes a visualisation
aid only, making it impossible to perform any
actual scientific research.10
Spatial analysis is an important methodology
for disease mapping and identifying risk areas.
It has the intrinsic ability to reveal patterns
i n data that have not been previously
observed. The recent advancement in spatial
analysis by incorporating GIS with spatial
statistics tools enables the epidemiologist to
look at the occurrence of the disease’s spatial pattern and the possibility of an outbreak in a
region more accurately.11,12 Spatial statistics
uses statistical methods to examine spatial
data to assess spatial processes, discover
patterns, and model them in a geographic
context. It is based on inferential statistics and
hypothesis testing. There are several
methods, approaches, and techniques through
which spatial analysis can be conducted.
These methods tend to answer three important
questions: what, where, and why/how. The
question of what is generally answered by
descriptive statistics, while the question of
where gives an understanding of exploration.
The question of ‘where’ is one of the important
aspects of spatial analysis, which is applied
to explore and map data and identify trends
and associations with space. The third and
most important aspect of spatial analysis is
to explain not only the trend and association
of data concerning space but also the cause
of these events and the drivers behind these
occurrences. Therefore, in addition to
straightforward visual analysis, spatial
statistics give the user the ability to reliably
respond to inquiries and make significant
decisions. One way to gain a deeper
knowledge of geographic phenomena, identify
the reasons behind certain geographic
patterns, summarise the distribution of a
single number, and make judgements with
more certainty is to utilise spatial statistics.13
Thus, spatial analysis methods enrich
research by revealing hidden information
through the analysis of spatial data.
The present research incorporates spatial
analysis along with disease mapping by
building its base on exploratory spatial data
analysis methodology for understanding the
spatial distribution of the vector-borne
disease, their endemicity to the region and
their spatial pattern. For this purpose, the
methodology undertook the epidemiological
data from the State Malaria office and these
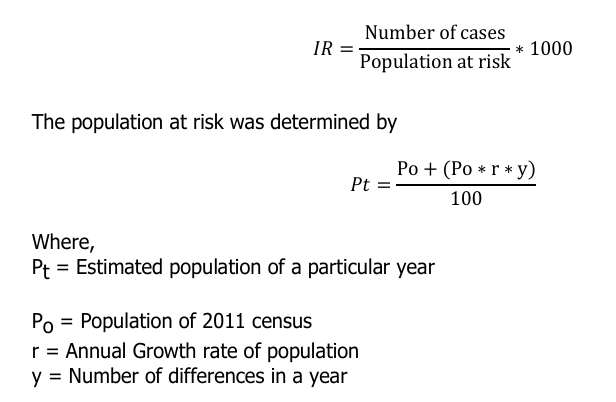
raw data are converted into disease incidence
by Incidence rate (IR).
The calculated disease incidence is smoothed
to reduce noise prevalent in the data with the
help of Bayesian methodology which is freely
available in Geoda application and these
smoothed data are used for the spatial
association, especially the Global Moran I,
Local Moran I (Cluster and Outlier analysis)
and Getis Orb Gi* Hot Spot analysis. The
cluster-outlier analysis is performed for the
vector-borne disease in our research with the
help of ArcGIS. The spatial continuity or
neighbourhood feature also known as Queen
contiguity was utilized for conducting the
cluster outlier analysis and Hot Spot
analysis.14,15,16
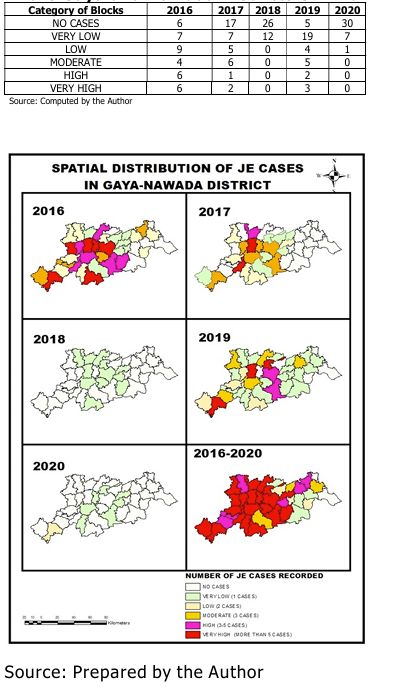
When we look at how JE/AES cases were
distributed in Gaya and Nawada districts in
2016, it is clear that there is an unequal
distribution. Six blocks in the area had no JE/
AES cases reported, the majority of these
blocks are in the Nawada district, while the
Gaya district only has one block with no JE/
AES cases reported. The Gaya district’s
Wazirganj Block had the highest cases
reported of any block in 2016, at ten. The two
other high-case reporting blocks are Manpur
Block (8 cases) and Gaya Town CD Block (9
cases). Low cases (below 3 cases) are
reported in 16 out of the 38 blocks in the region
(Table 1). The spatial distribution of JE/AES cases in
2017 exhibits a clear pattern, with the highest
number of cases coming from Gaya CD Block
i tself, where 11 cases of JE/AES were
documented. Another significant number of
JE/AES cases (7 cases) were reported in 2017
from the Sherghati block in the southern
eastern area of the Gaya district. In 2017,
the number of Blocks reporting no cases of
JE/AES increased from 6 to 17 Blocks in the
Gaya-Nawada district. In 2018, there were
much fewer JE/AES cases reported in the
Gaya area, including the Nawada district.
There are currently 26 blocks that have not
reported any JE/AES incidents in 2018. The
number of JE/AES cases reported by the
remaining 12 blocks has also shrunk to only
one. As a result, the trend of declining JE/
AES incidences persisted in 2018, which was
encouraging for the area. However, the
downward trend of JE/AES cases from 2016
to the lowest level in 2018 has been reversed
in 2019. 2019 has seen a reduction in the
number of blocks reporting no incidences of
JE/AES, from 38 to only 5. 18 cases, which is
the highest number of cases documented, are
from the Gaya block. Each of the other two
blocks, Imamganj and Atri, reported six
incidents in 2019. In 2019, the 19 blocks
report single JE/ AES cases. In contrast, in
2019 there were 5 block reports 3 cases of
JE/AES and 4 block reports 2 cases. According
to the 2020 data, there have been much less
JE/AES reports in the districts of Gaya and
Nawada. 30 Blocks out of 38 Blocks reported
no cases of JE/AES. Only seven blocks,
predominantly in the Gaya District, report a
single case of JE/AES in 2020. The only block
in the Gaya District to record two occurrences
is Imamganj (Figure 1).
Table-1: JE/AES reported Blocks in Gaya
Nawada District.
Figure 1: Spatial Distribution of JE/AES
Cases in Gaya-Nawada District.
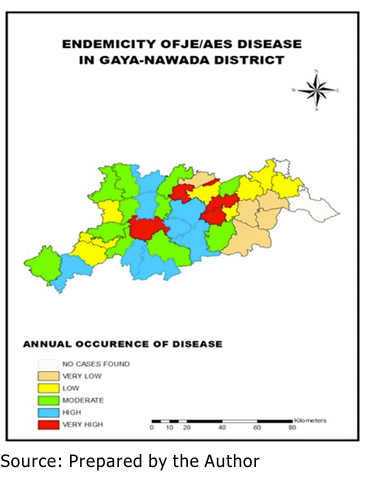
Endemicity of JE/AES in Gaya-Nawada District
When we look at the endemicity of JE/AEs in
Gaya- Nawada District we can see that only 2
blocks out of 38 blocks have not recorded any
instances of JE/AES in the research period.
These two blocks are both located in the
Nawada District. While Hisua and Meskaur
blocks in the Nawada district are classified
as highly endemic to the JE/AES epidemic,
Bodh Gaya and Atri blocks in the Gaya district
have continually recorded cases of JE/AES
during the research period between 2016 and
2020. There are eight blocks in the Gaya
Nawada district that record cases for
consecutively four years out of five year study
period and hence considered as high endemic. The greatest number of blocks (11 blocks) are
moderately endemic (Figure 2).
Observing the pattern of a disease’s incidence
through time and space is one of the main
objectives of determining the risk of the
disease. According to the first law of
geography (Tobler, 1970), objects close to one
another interact and have more similarities
than those farther apart and are referred to
as “spatial dependency.”
The analysis of spatial autocorrelation in
geographic studies is crucial. The relationship
between attribute values at nearby locations
and whether these values form patterns in
space are investigated using spatial
autocorrelation. Geographical analysis would
not be very interesting if there were no spatial
autocorrelation (O’Sullivan & Unwin, 2010).
Spatial autocorrelation can be detected using
a variety of diagnostic techniques. The most
important and prevalent method is through
Global Moran I (Spatial auto-correlation).
Global spatial autocorrelation measures are
those that estimate spatial auto-correlation
by a single value for the entire study area.
The most common Global Spatial auto
correlation measures are Moran I Index.
Global Moran I for JE/ AES in Gaya
Nawada District
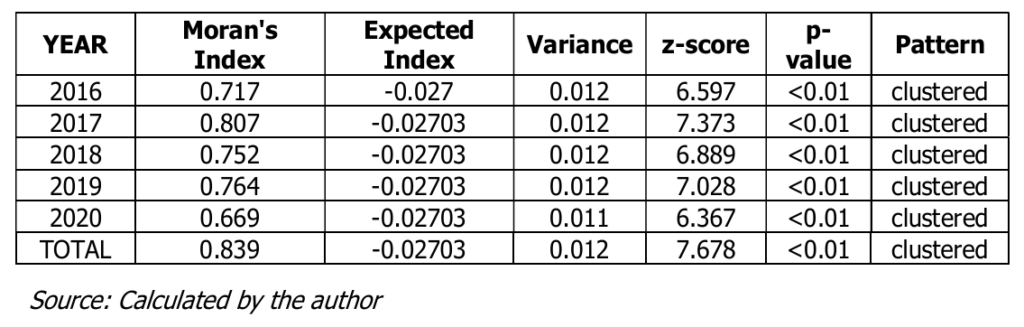
Global Moran I was used to analyse the spatial
autocorrelation for Japanese Encephalitis/
Acute Encephalitis Syndrome in the Gaya
Nawada region. The outcome demonstrates
that the disease was discovered to be
concentrated in the district over the entire
study period. The table shows that 2017 and
2019 have the highest z scores, which are all
significant at 99 per cent, 2017 saw the
highest Moran I values recorded. The
variance has not changed over the course of
our study. We discovered that, on average,
during the 2016–2020 study period, the z
score was 7.678 with a high Moran I index of
0.839 and a 99 per cent significant level of
significance (Table 2).
Table-2: Spatial Auto-correlation
estimation Moran’s I index of JE/AES in
Gaya Region.
Cluster and Outlier Analysis
A cluster is defined as an overabundance of
cases in either area known as a geographical
cluster, time a temporal cluster, or both space
and time (Boulos, 2004). The cluster and
outlier analysis through Local Moran I
provides us with a better understanding in
terms of the distribution of features in a more
localised manner and provides a clear picture
of the distributional pattern of diseases. The cluster and outlier analysis provides results
into four major categories of high- high cluster
and low-low cluster and outlier in terms of
high – low outliers and low-high outliers.
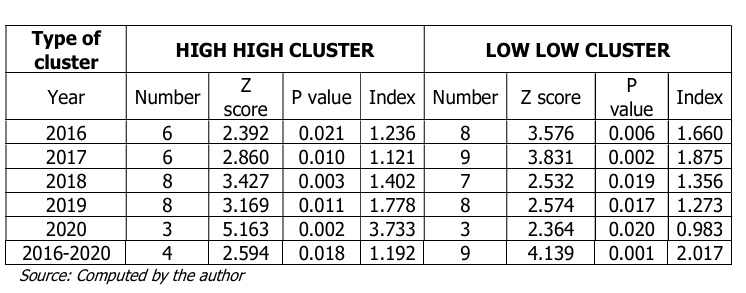
Table-3: Cluster analysis of JE/AES in
Gaya-Nawada District.
The Cluster and Outlier analysis of JE/AES
disease was conducted at the block level to
map the localisation of these clusters in the
Gaya-Nawada District. A distinct pattern is
observed in our analysis as the cluster, both
high and low cluster, was observed in the
region but there was no outlier, both high low
and low high outlier, observed during our
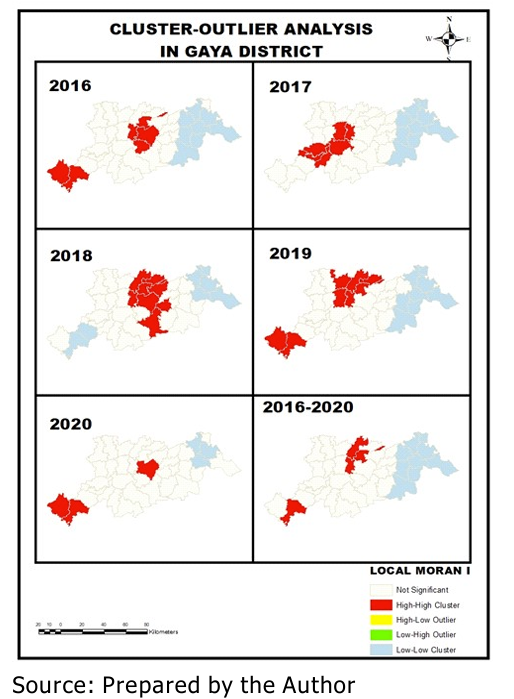
study period. The cluster of high-incidence
reporting blocks also saw an uneven trend as
we can observe from Figure 3. The number
of high clusters observed in 2016 and 2017
was 6 which increased to 8 clusters of Blocks
in 2018 and 2019, but suddenly decreased to
3 blocks in 2020. The Manpur block distinctly
forms part of the high cluster in the year
between 2016 to 2019. The mean Local Moran
z score obtained through local Moran I
analysis shows that the highest value was
observed in 2020 despite having a low number
of clusters of blocks in 2020. The z value
obtained through our analysis shows that the
z score was significant at 95 per cent in 2016,
whereas in the rest of the year, from 2017 to
2020 was highly significant at 0.01. The low
cluster obtained from our analysis is mainly
located in the western part of the Nawada
district. The number of the low cluster also
shows an irregular trend in our research
period where the lowest number was
observed in 2020 in comparison to the highest
number observed in 2019. The low cluster
block mainly consists of the Kasi Chak,
Warisaliganj, Pakribarawan, Roh and Kawakol
blocks of the Nawada district. The one
interesting feature noticed in our analysis of
low cluster results is the Imamganj block of
Gaya District which was part of the High
Cluster block in 2016, 2019 and 2020 and was
categorized into a low cluster block in 2018.
The Local Moran z score obtained through our
analysis also that all of these low clusters are
formed of high significant p value at 0.01.
There was a complete absence of any outliers
during our research period from 2016 to 2020
(Table 3).
Figure-3: Cluster and Outlier Analysis in
Gaya-Nawada District.
Hot Spot Analysis of JE/AES in Gaya
Nawada District
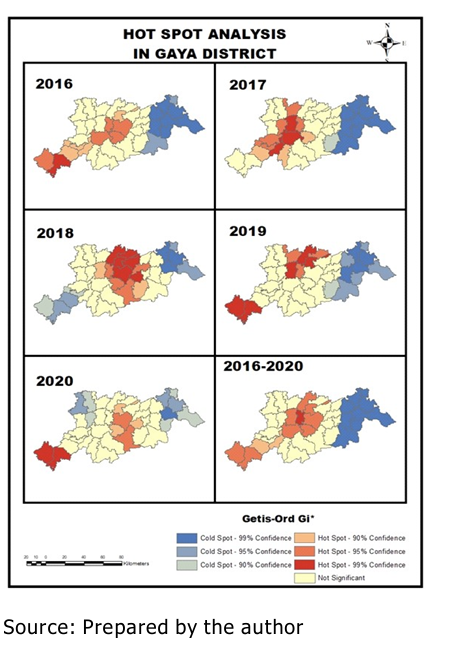
According to a 2016 hot spot research, there
was 99 per cent confidence that the Imamganj
block in the Gaya district was a hot site.
Wazirganj, Manpur, Tankuppa, and Bodh Gaya in the region’s heart, where confidence was
95 per cent, and the Dumaria block in the
south, where confidence was 95 per cent,
served as the other hub of the block, which in
2016 created the JE /AES hot spot cluster.
Although they were also hotspots in 2016,
Banke Bazar, Sherghati, Amas, and Atri blocks
had lesser confidence (90 per cent) than
those. There are no cold spots; all the hot
spots are in the Gaya district. On the other
hand, Nawada is, with 99 per cent to 95 per
cent confidence, the epicentre of cold patches
in the northeast of the region. With a 98 per
cent confidence level, the 2017 hot spot
research identifies three blocks in the districts
of Sherghati, Bodhgaya, and Gaya CD as hot
spot centres. With 95 per cent probability, the
adjacent blocks have also evolved into the hot
spot’s centre. The fact that a new block has
become a hot area now rather than in 2016
is an intriguing change that can be noticed in
2017. Belaganj, Paraya, Gurua, and Dobhi are
the new structures that have recently emerged
as hotspots. As was stated in 2017, all hot
spot blocks are still located in the Gaya
district. The Nawada district contains the
location of every cold spot centre.
The hot spot centre is now firmly positioned
in the northern half of the region, according
to the analysis of the hot spots in 2018.
Compared to the preceding two years, there
are more hotspots where blocks can form. The
hot spot’s 12-block radius has expanded to
include these blocks. The Gaya District’s
Kizirsarai, Neem Chak Bathani, Atri, Muhra,
and Wazirganj block is now a hot zone with
99 per cent control. An essential component
of 2018 demonstrates that the Mesakur
district of Nawada also consistently showed
as the district’s centre with 99 per cent
certainty. In 2018, the Nawada district’s
Hiroshi, Surala, and Fatapur districts also
became hot spots. Blocks including Paraiya,
Sherghati, and Gurua from the beginning of
2017 have vanished in 2018. The fact that the
hot places in 2016 and 2017 were located in
the blocks Dumaria, Imamganj, and Amas in
2018 instead became the cold locations is an
additional intriguing feature of the year. In
2018, there were less cold patches in
Nawada, which is still in the northeast of the
region. The Dumaria and Imamganj blocks in
southern Gaya district are currently becoming
hot zones with 99 per cent probability,
according to 2019 study. The Gaya CD block,
Atri, and Khizisarai are the other blocks that
make up the 99 per cent confidence interval.
With 95 per cent, Belaganj, Nhim Chak Sarai,
and Manpur are in first place. As a result, there
are fewer hotspots now in 2019. No specific
block has developed as a hotspot in the
Nawada district. The north of Nawada District
has consistently been noted to have cold
patches (Figure 4).
Figure-4: Hot-Spot analysis of JE/AES
Cases in Gaya-Nawada District.
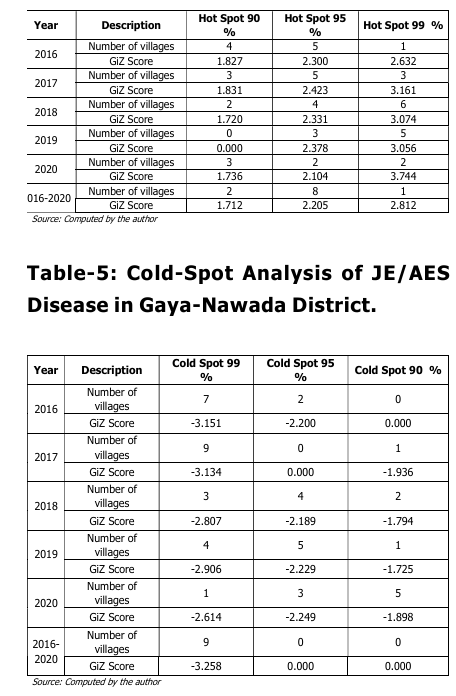
Table-4: Hot-Spot Analysis of JE/AES
Disease in Gaya-Nawada District.
The examination of 2020’s hot spots reveals
a sharp decline in hot spot block. The Dumaria
and Imamganj block, which had 99 per cent
confidence in 2019, had continued in 2020.
With 95 per cent and 90 per cent confidence
in 2020, the Nawada district’s Fatehpur and
Mesakur block has already emerged as a hot
spot centre. The other block in the Gaya
district that has emerged as a hot zone for
2020 is Atri, followed by Tankuppa block with
90 per cent certainty and Wazirganj with 95
per cent confidence (Table 4). In the cold spot,
where two centres can be seen emerging in
2020, the significant difference can be
noticed. Nawada district’s north-eastern block
and Gaya district’s north-western block (Table
5).
The analysis by space and time tells a different
story with respect to JE/AES in the Gaya and
Nawada districts, with Gaya regarded as the
high-risk location while Nawada has rather
sporadic incidences. Spatial clustering at
blocks like Manpur and Imamganj exhibits a
perennial endemicity, with some ecological
and social factors at play. Other studies had
highlighted environmental factors such as
rainfall and temperature in vector abundance
and JE outbreaks.17,18 Agricultural activities and
existence of piggeries near human habitation
add to this risk.19,20 GIS-based spatial statistics
such as Moran’s I and Getis-Ord Gi* have
greatly aided in defining these high-risk
pockets as targets for evidence-based public
health interventions.21 The patterns share
resemblance with those recorded from similar
endemic zones in Assam and Tamil Nadu.22,23
The continued existence of the hotspots in
Manpur, Imamganj and Atri blocks might be
connected to the social ecology of these
areas. The disease burden is a result of
several factors including high rural
populations, lack of awareness regarding
mosquito control, limited vaccination coverage
and poor health-seeking behavior. In addition,
seasonal migration among agricultural
laborers, which is a common practice in these
areas and the setting up of pig farms close to
human habitations are community-based
environmental factors that might further
spread JE. It has been found in eastern Uttar
Pradesh and Nepal that the social factors
operating at the level of the community are
as significant as the climatic or environmental
variables in determining the JE risk clusters.
Combining these social aspects with spatial
epidemiology will not only improve
surveillance but also enable the
implementation of equity-based public health
interventions. Outbreaks being cyclic in nature
and resurgence coming in regular seasons
further call for aggressive surveillance
coupled with the early-warning systems.24
Known cases of vaccination and community
awareness administration have proved
effective in reducing the burden of JE, especially among children.25,26
The study of Japanese Encephalitis/ Acute
Encephalitis in Gaya Nawada region also
provides us interesting result through our
spatial analysis. Even though when we look
at the cases reporting from the block the
uneven yearly trend of Japanese Encephalitis
can be easily noticed but in between our study
period we can see that 2016 and 2020 itself
the disease has outbreak in the region. The
spatial analysis conducted in our study reveals
that the block in Gaya district are more at risk
of the outbreak of JE/AES than Nawada
district. The Mapur Block in the Gaya district
emerges as the high cluster and Hot Spot in
our study period 2016 to 2020. The other block
that emerges as the new centre of the
outbreak of the disease is Imamganj block as
the disease outbreak has taken place in 2016
and 2019. The other important risk blocks that
need to be in constant surveillance are Gaya
C.D. block, Bodh Gaya block and Atri block.
As these blocks have also constantly reported
the cases of Japanese Encephalitis.
The research could pursue further integration
of real-time geospatial surveillance systems
with climate modeling into socio-demographic
analytical tools to provide for better early
warning mechanisms in JE/AES. Upgrading
l ocal healthcare systems, expanding
vaccinations, and maintaining constant
supervisory watch over high-risk locations for
immediate responses will be imperative for
long-term mitigation of disease transmission
and vector control.
Future studies should incorporate block-wise
social indicators literacy, access to sanitation
and available healthcare into the GIS
framework so as to disclose compounded
vulnerability. Public health measures in the
high-risk blocks such as Manpur and
Imamganj should not only focus on vector
control but also consider community
awareness, vaccination drives and education
outreach. The social aspect is essential for
shifting from reactive containment to
proactive prevention in the endemic areas of
Bihar.
The authors extend their gratitude to all the
referenced authors and digital sources that
contributed to the content cited in this work.
Anselin L. The Moran Scatter Plot as an ESDA
Tool to Assess Local Instability in
Spatial Association. In: Fisher M,
Scholten H, Unwin D, eds. Spatial
Analytical Perspectives on GIS.
London: Taylor and Francis;
1996:111-125.
Bhatt P, Rao S, Thapa BR. Outbreak
investigation of Japanese encephalitis
in Malkangiri, Odisha. Int J Community
Med Public Health. 2018;5(2):651
655.
Boots BN, Getis A. Point Pattern Analysis.
Newbury Park, CA: Sage Publications;
1988.
Borthakur A, Deka NM, Islam S, et al.
Seroprevalence of Japanese
encephalitis among children in Assam.
Indian Pediatr. 2018;55(3):219–221.
Chakraborty A. GIS in Epidemiological Spatial
Dynamics. 14th ESRI India User
Conference. 2013:1.
Chaput EK, Meek JI, Heimer R. Spatial analysis
of human granulocytic ehrlichiosis
near Lyme, Connecticut. Emerg Infect
Dis. 2002;8(9):943-948.
Desai A, Ganesh M, Rao V. Spatial distribution
and risk mapping of Japanese
encephalitis in Tamil Nadu. J Vector
Borne Dis. 2015;52(4):321–326.
Dutta P, Khan SA, Khan AM, et al. Japanese
encephalitis epidemiology in Assam,
India: a 10-year retrospective study.
UGC CARE List Journal
93
Indian Journal of Health Social Work. 8(1) January-June, 2026
Spatio-Temporal Risk Mapping of Japanese Encephalitis/Acute Encephalitis Syndrome in
the Gaya and Nawada Districts of Bihar
Indian J Med Res. 2011;133(3):331
336.
Hegde NR, Gore MM. Japanese encephalitis
vaccines:
i mmunogenicity,
effectiveness, and impact. Hum Vaccin
Immunother. 2017;13(6):1320–1327.
Kumar K, Sharma AK, Chaturvedi RK, et al.
Entomological investigation of JE
outbreak in Gorakhpur. Indian J Med
Res. 2005;121(4):333-339.
Kumar M, Singh K, Topno RK, et al. Prevalence
of Japanese encephalitis infection in
children below 15 years of age in Bihar,
India. Diagn Microbiol Infect Dis.
2025;102(2):116579.
Kumar P, Pisudde PM, Sarthi PP, Deshmukh PR.
Climatic determinants of Japanese
encephalitis in Bihar State of India: a
t ime-series Poisson regression
analysis.
J
Commun Dis.
2017;49(4):13–18.
Mathur A, Arora KL, Rawat DS, et al.
Experimental
viraemia
and
transmission of Japanese encephalitis
virus by mosquitoes in India. Indian J
Med Res. 1982;76:12–19.
Mishra R, Kumar G. Epidemiological report on
AES/JE outbreak in Bihar & planning
perspectives for its control. Am J
Health Res. 2014;2(6):404–410.
Murty US, Rao MS, Arunachalam N. The
effects of climatic factors on the
distribution of Japanese encephalitis
vectors in Kurnool district, Andhra
Pradesh. J Vector Borne Dis.
2010;47(1):26-32.
National Vector-borne Disease Control
Programme. Annual Report 2011.
https://ncvbdc.mohfw.gov.in/Doc/
Annual-report-2011-12-NVBDCP
National Vector-borne Disease Control
Programme. Guidelines-Mosquito
and-other-vector-control-response
2020.
2020.
ncvbdc.mohfw.gov.in
https://
O’Sullivan D, Unwin D. Geographic Information
Analysis and Spatial Data. 2010.
doi:10.1002/9780470549094.ch1
Pant DK, Tenzin T, Chand R, et al. Spatio
temporal epidemiology of Japanese
encephalitis in Nepal, 2007–2015.
PLoS One. 2017;12(7):e0180591.
doi:10.1371/journal.pone.0180591
Singh RK, Dhole TN. Molecular epidemiology
and genetic diversity of Japanese
encephalitis virus in India. J Infect
Public Health. 2015;8(1):11-18.
Srivastava A, Kumar A, Thomas JD, et al.
Spatio-temporal epidemiology of
Japanese encephalitis virus infection
in pig populations of eastern Uttar
Pradesh, 2013–2022. Zoonoses Public
Health. Published online 2024.
Tiwari S, Singh RK, Tiwari R, Dhole TN.
Japanese encephalitis: a review of the
Indian perspective. Braz J Infect Dis.
2012;16(6):564–573.
Verma S, Gupta RD. Spatial and temporal
variation of JE disease and detection
of hotspots: Gorakhpur, Uttar Pradesh,
India. ISPRS Ann Photogramm
Remote Sens Spatial Inf Sci. 2014;II
8:1–7.
World Health Organization, World Bank.
Global vector control response 2017
2030. News.Ge. 2017;4.
Wrigley N, Holt T, Steel D, Tranmer M.
Analyzing, Modeling and Resolving the
Ecological Fallacy. In: Longley P, Batty
M, eds. Spatial Analysis: Modeling in
GIS Environment. New York: John
Wiley and Sons; 1996:23-30.
Zhang C, Luo L, Xu W, Ledwith V. Use of local
Moran’s I and GIS to identify pollution
hotspots of Pb in urban soils of
Galway, Ireland. Sci Total Environ.
2008;398(1-3):212–221.